
18 Sep | Insight Report
Available for Purchase
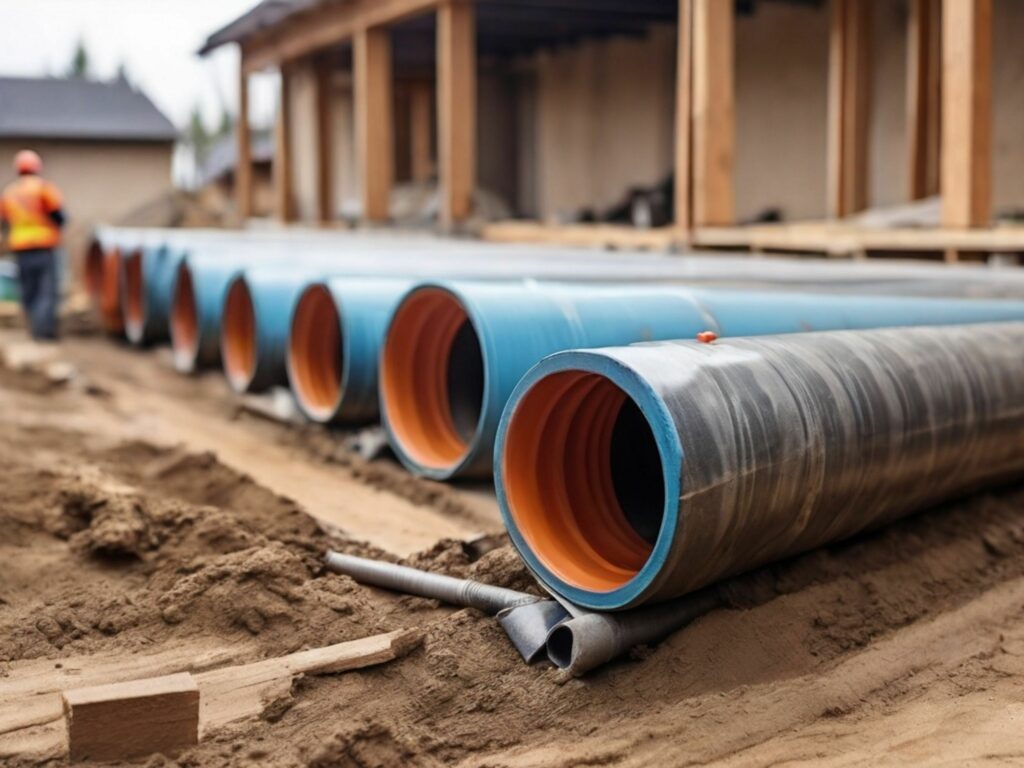
Smart Irrigation: Data-Driven Control & Platform Integration for Water Management in U.S. Agriculture ->
Digital technologies represent the fastest-growing segment of the U.S. irrigation market, expanding at an 8.7% compound annual growth rate through 2036. On-farm digital solutions are growing even more rapidly at 10.2%.Available for Purchase

14 Sep | Insight Report
Corporate Subscription
State Profile: Illinois Water Market ->
Illinois received US$295 million in federal lead service line funding, 10.76% of the national pool and the largest single-state award, to help address more than 700 thousand lead lines statewide.Corporate Subscription

3 Sep | Insight Report
Corporate Subscription
State Profile: Ohio Water Market ->
Ohio relies on a balanced mix of roughly 50% surface water sources and 50% groundwater sources. Over the next 20 years, the state will require nearly US$30.7 billion to repair, expand, and maintain its infrastructure for drinking water, wastewater, and stormwater.Corporate Subscription

24 Aug | Insight Report + Data
Corporate Subscription
Leading Water Engineering and Construction Firms: Profiling Company Strategies and Trends ->
Water has become a strategic growth market for engineering and construction firms despite remaining a minority of overall revenue. Across the firms analyzed, water accounted for only 15%–23% of total revenue, yet companies continue to invest in acquisitions, artificial intelligence, and geographic expansion to strengthen their competitive positions.Corporate Subscription
24 Aug | Data Insight + Data
Corporate Subscription
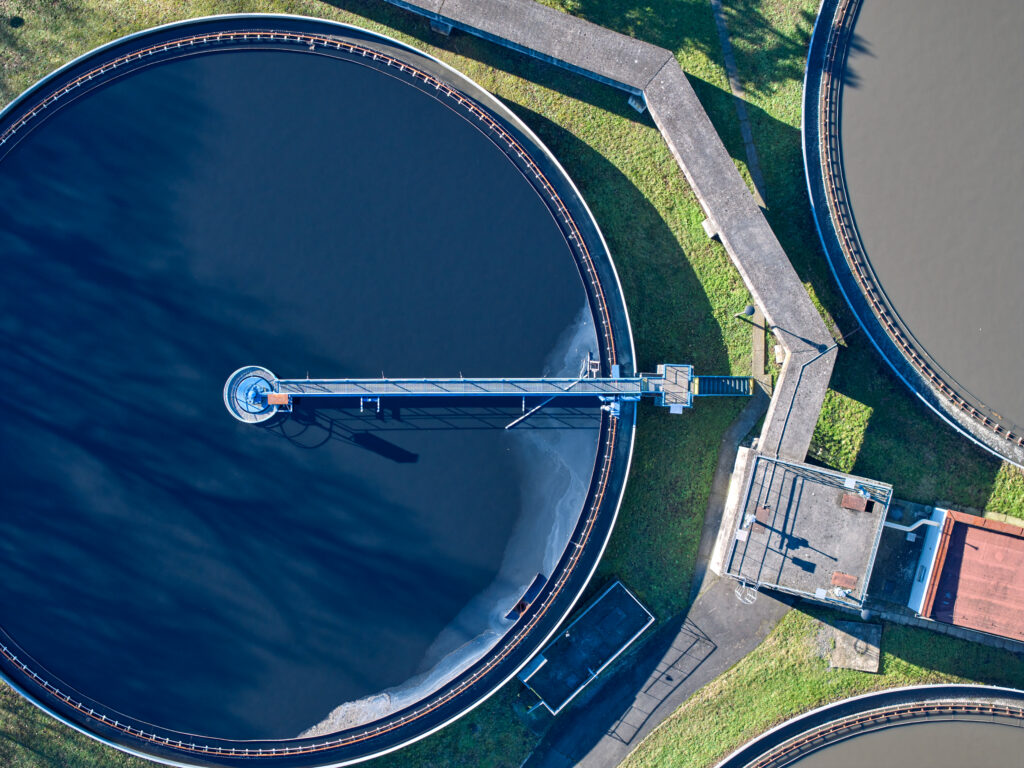
U.S. & Canada Municipal Utility Capital Improvement Plans, 2026–2036 ->
Bluefield’s team of water experts has collected, cleaned, and analyzed published CIP data from more than 725 utilities across the U.S. and Canada. This CIP analysis translates utility capital needs into market opportunities for technology and equipment vendors as well as engineering and construction firms.Corporate Subscription
6 Aug | Insight Report + Data
Corporate Subscription
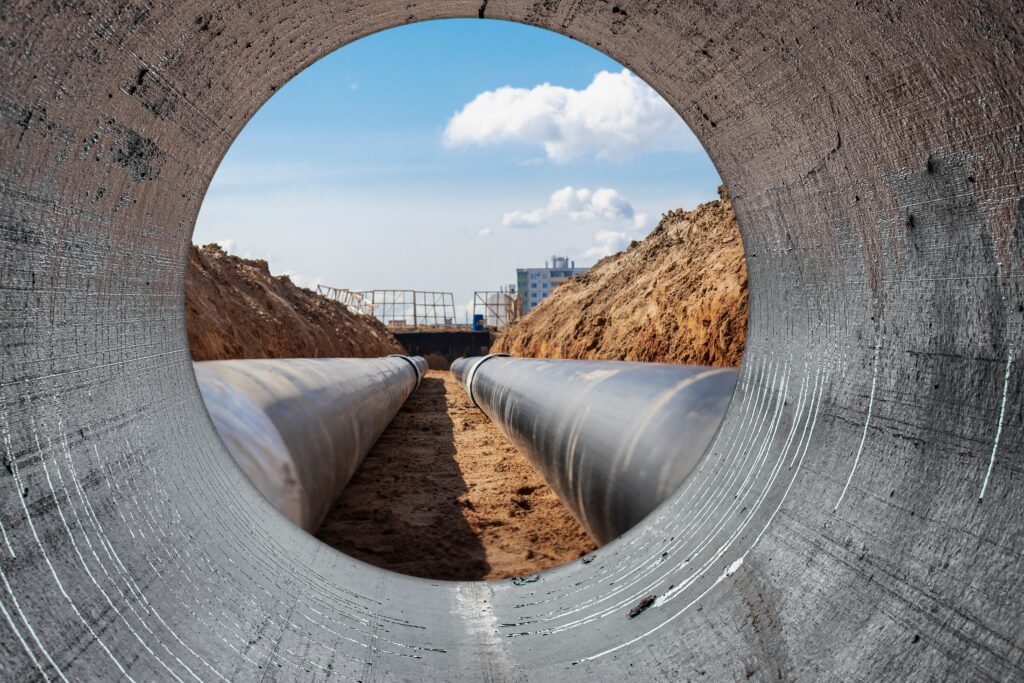
U.S. & Canada Municipal Drinking Water and Wastewater Pipe Forecasts, 2026–2035 ->
The U.S. & Canada pipe market, valued at US$99.3 billion from 2026–2035, continues to shift from growth to renewal. Overall capital expenditures grow at a modest 2.0% compound annual growth rate, from US$9.07 billion in 2026 to US$10.88 billion in 2035.Corporate Subscription

30 Jul | Data Insight + Data
Corporate Subscription
The U.S. Federal Funding Cliff: Sizing the Decline and Mapping the Exposures for States and Utilities ->
Federal funding has historically represented a small share of total water infrastructure investment, with state and local governments covering 96% of spending in 2023 versus 4% from the federal government.Corporate Subscription