Companies across the water industry value chain are constantly seeking an edge to better position their products and solutions against their peers. They also want to understand the following:
- Where are potential customers located?
- What projects match vendor products?
- What is the available budget?
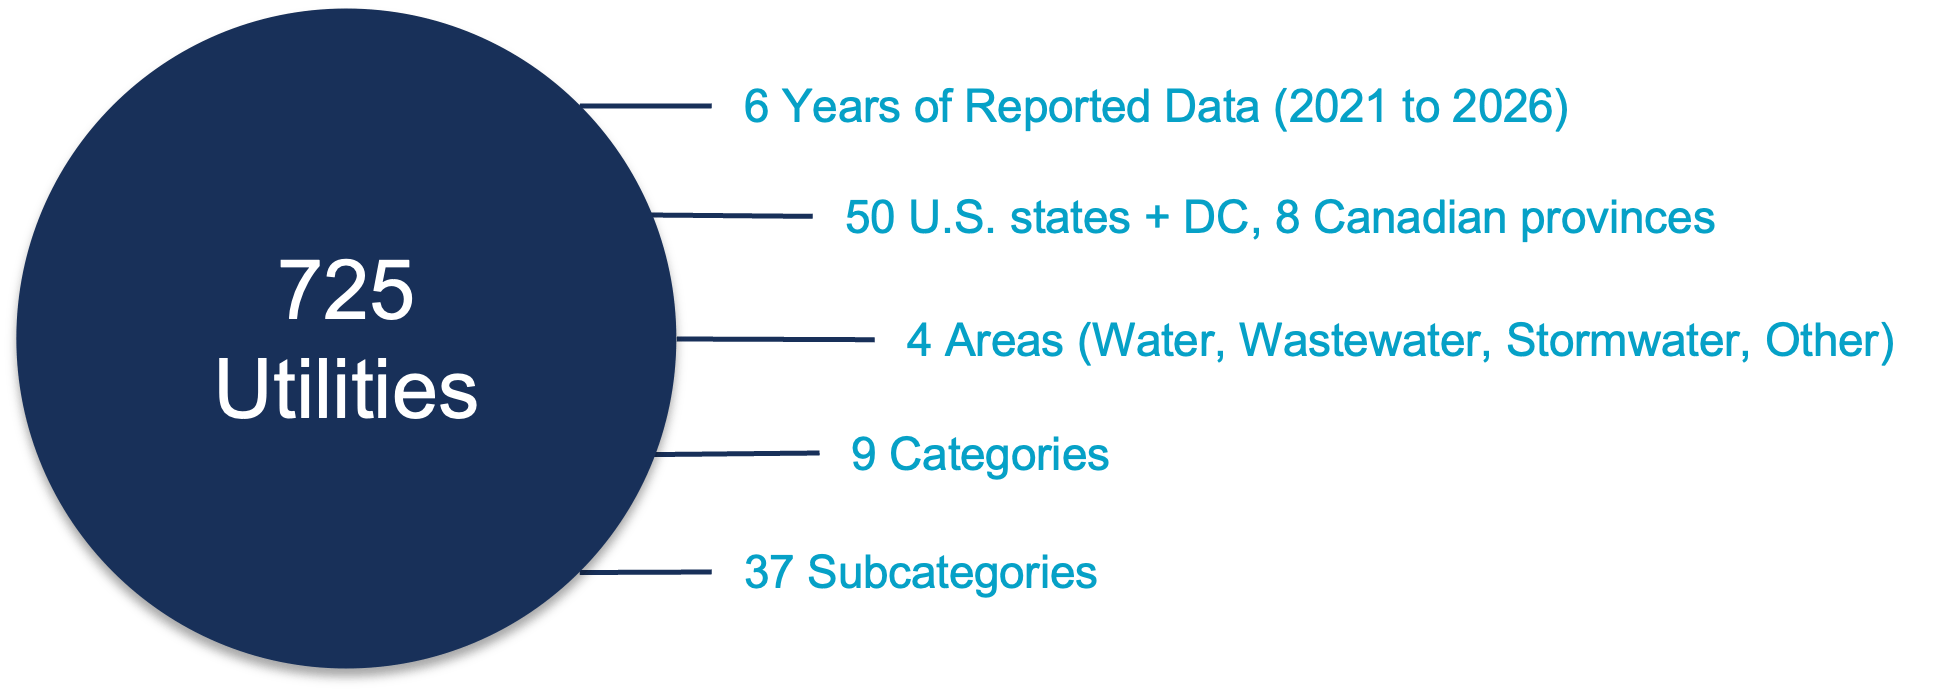
Bluefield’s team of water experts has dedicated significant time and resources to supporting companies with bottom-up data collection and analysis of the capital improvement plans (CIPs) of 725 large and mid-sized drinking water, wastewater, and stormwater utilities across the U.S. and Canada.
These CIPs translate utility capital needs into market opportunities for technology and equipment vendors as well as engineering and construction firms. Bluefield has systematically organized and categorized tens of thousands of projects across 4 areas, 9 categories, and 37 subcategories.
Overview:
Leveraging a demonstrated research methodology and data management expertise, Bluefield’s team has packaged a robust set of bottom-up CIP data for companies that includes:
- Geographic coverage of 50 U.S. states and Washington, DC, 8 Canadian provinces; serving 206.7 million people in total
- Line-item data for 34,914 capital projects classified across 4 distinct areas, 9 categories, and 37 subcategories
- Option to access data via Bluefield’s online and interactive Bluefield Data Navigator platform
- Budget outlook spanning 2026–2036
- Dataset updated on a rolling basis; the 2026 analysis is ongoing as utilities release new and revised CIPs
Sample Insights:
- The 725 utilities captured in Bluefield’s CIP analysis account for a combined US$382 billion in planned and projected spend between 2026 and 2036, with 46% earmarked for wastewater, 44% for drinking water, and 9% for stormwater.
- More than three-quarters of the US$382 billion is budgeted in the first five years as many utilities’ capital improvement plans stretch only one- to five- years out. Only 9% of utilities (64) currently provide some visibility into 2036, versus 100% (725) for 2026.
- CIP data shows capital priorities shifting with utility size. Wastewater rises from 40% of planned spend among utilities serving 50k–100k people to 52% among systems serving more than one million people, while drinking water falls from 48% to 38%.