Home • Our Coverage • Cost of Water
Cost of Water
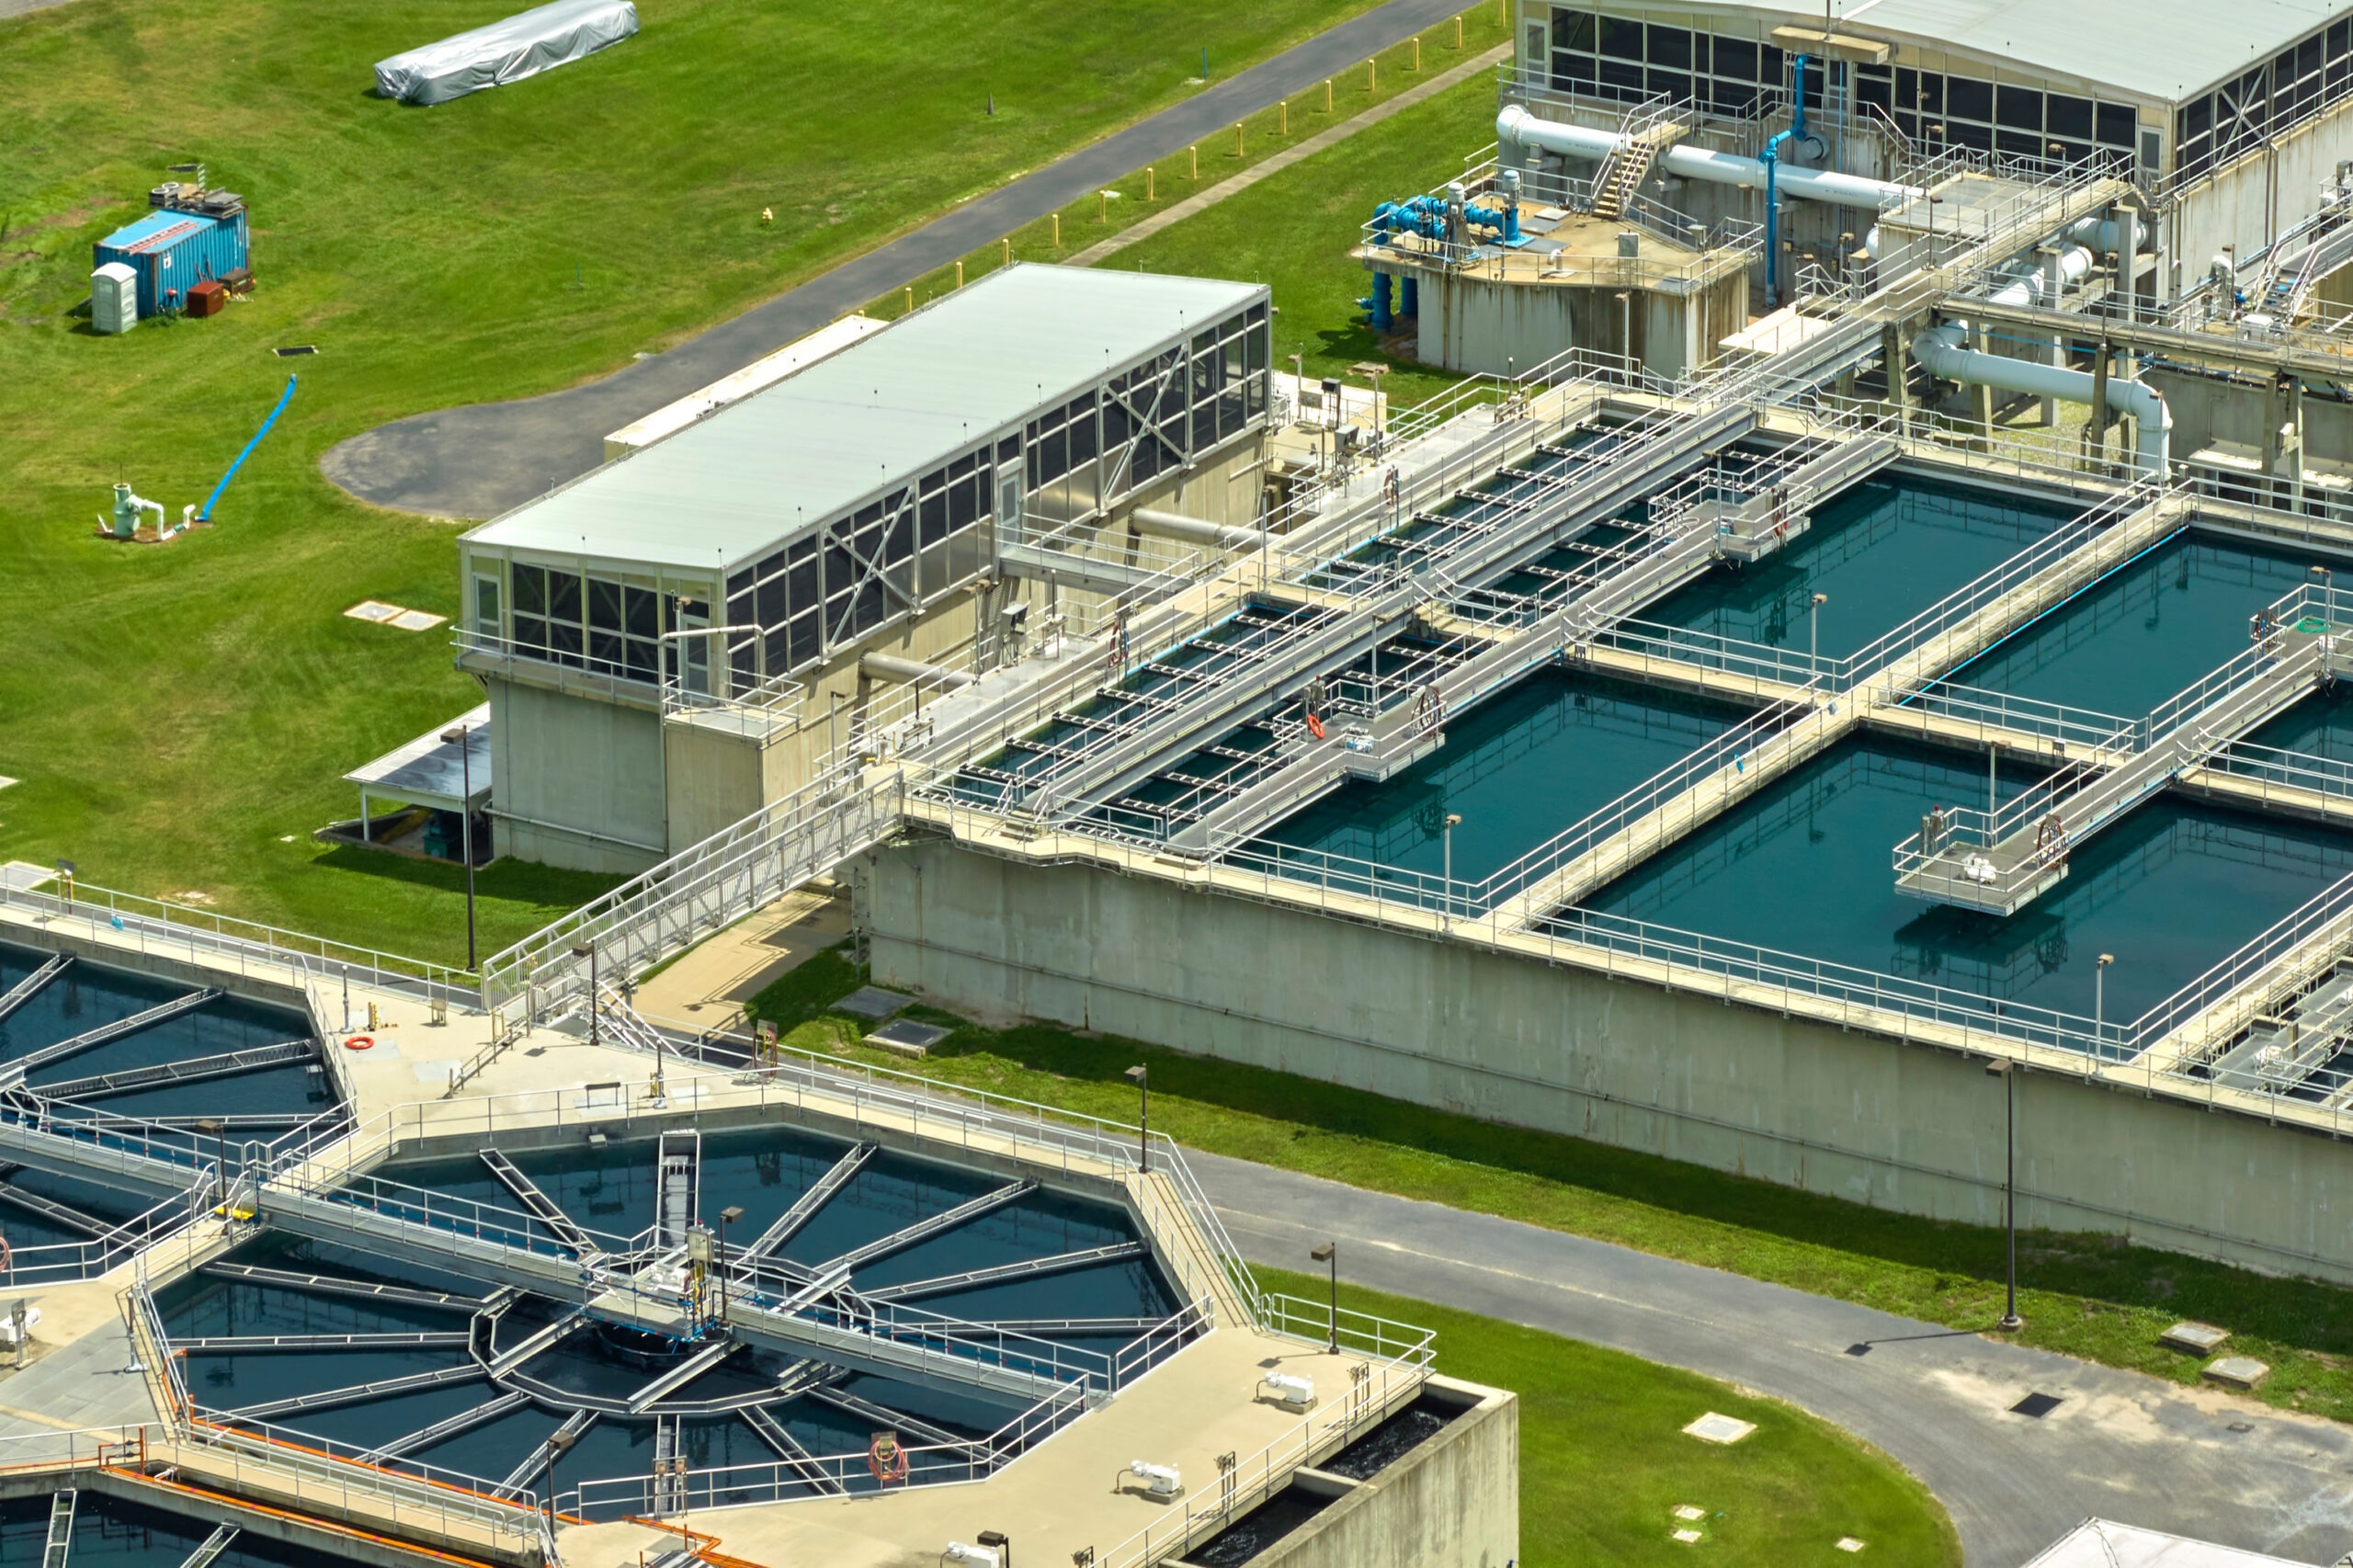
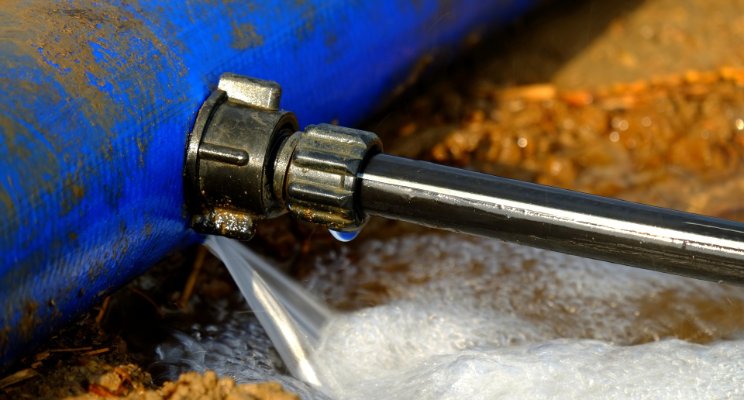
The cost of providing water & wastewater services is climbing in response to aging infrastructure, more advanced treatment to address water quality concerns (e.g., PFAS), algae bloom mitigation, and climatic events. The impact is showcased by residential water bills in the U.S. that have outpaced average annual income growth (5%) and inflation rates (1.9%).
Recent Analysis

Non-revenue Water: U.S. Municipal Utility Water Losses, Costs, and Trends

U.S. Municipal Utility Water Rates Index 2024: Drinking Water & Sewer

Eight U.S. Water Market Trends to Watch: Looking over the Horizon

Decoupling Water Rates on California Agenda

Rethinking Water in the Home: Trends, Opportunities, and Strategies

Domestic Water: Drivers and Emerging Trends for Advanced Water Management in the Home, U.S., U.K., Australia


Harmful Algal Blooms:

France PFAS Ban Advances Europe Remediation

EU Struggles to Enforce Wastewater Regulations While Expanding Scope

3M Windfall for Impacted PFAS Water Systems

Read more research on water quality
Key Research Questions

What is the average water rate across the top 50 U.S. cities?

How do water rates compare to other utility bills and inflation?

How do different water supplies, such as reuse and desalination compare?

What strategies are utilities employing to address non-revenue water?
Cost of Water Data
24%
rise in U.S. water and sewer bills since 2019
US$125
average monthly water and sewer bill in the U.S.
US$6.7 trillion
global water infrastructure needs by 2030
11
hours of water needed (on average) to pay a monthly water utility bill at minimum wage
Talk to our water experts about the cost of water