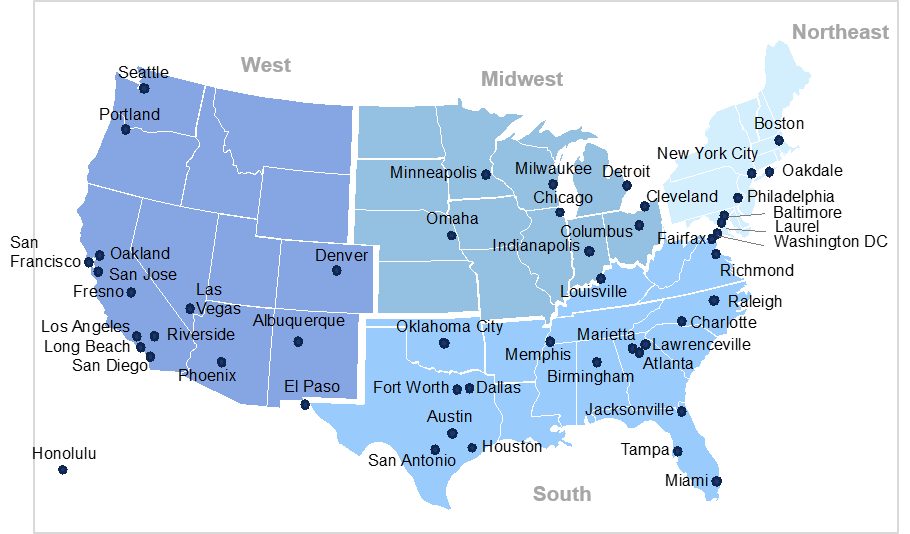
For the sixth consecutive year, Bluefield Research has embarked upon an analysis of the water and wastewater rates in the U.S. and the impacts on residential water and wastewater bills. Ratepayers represent the primary source of funding for municipal operating expenditures.
Each utility faces unique challenges that impact utilities’ rates. As demonstrated by the data, there is no formula or pattern from utility to utility. Public utility rates are mercurial and influenced significantly at a political and municipal management level. Further, emerging challenges posed by shifting consumer behaviors and the need for additional revenue to improve aging infrastructure are compounding with traditional issues like drought and extreme weather fluctuations.
This Insight Report includes analysis of water & wastewater utility pricing in 50 U.S. metropolitan areas across 56 water and sewer utilities to identify key trends in municipal water utility bills.
Regions and cities evaluated:

Report Scope
- The utilities surveyed collectively provide potable water and wastewater collection and treatment services to approximately 20% of the U.S. population.
- Residential water and wastewater bills were calculated based on a 30-day billing period for standard 5/8” meters and reflect rates effective from 1 July 2020 to 1
June 2021 for various municipalities, respectively. - Bills were calculated using a benchmark national average consumption level in addition to specific regional average consumption levels to allow for a range of comparative conclusions to be drawn.
- Cities were grouped into four regions (Northeast, Midwest, South, and West) closely associated with those established by the U.S. Census Bureau in order to identify relevant regional variations in water and wastewater pricing.
Bluefield Takeaways
- Across the 50 largest metropolitan areas in the U.S., monthly household water bills average US$45.44 and monthly wastewater bills average US$66.20, based on average household consumption across the country.
- Combined household water and wastewater bills have increased an average of 4.2% per year over the past nine years.
- The most recent data from 2021 indicates a slight downtick in rate increases from the prior year. From 2020 to 2021, combined household water and wastewater bills from 50 cities increased by 4.31% whereas from 2019 to 2020, they rose 6.37%.
- For a typical U.S. household, wastewater, as a proportion of the combined monthly water and wastewater bill, has remained consistent at 59% from 2012 to 2021.
- Of the 50 water utilities analyzed, 39 feature a tiered price structure for residential water rates.
- Many utilities are attempting to balance water affordability with the need to generate revenue to operate water and wastewater systems by using tiered pricing to make water use less costly.

