4 February 2025, Boston, Massachusetts: The combined water and sewer bill for a typical U.S. household has increased by 4.6% from 2023 to 2024, according to Bluefield Research, a leading provider of global water market data and insights. This rise is being fueled by mounting operational costs, inflation, and necessary capital investments. Bluefield’s latest report, U.S. Municipal Utility Water Rates Index 2024: Drinking Water & Sewer, benchmarks a core set of water and wastewater utilities over the past five years (2019–2024) and reveals a 24.1% increase in combined drinking water and sewer bills, reflecting the mounting cost pressures impacting U.S. households.
“The cost of maintaining and upgrading water infrastructure continues to rise, and these costs are being passed down to ratepayers,” notes Megan Bondar, an analyst at Bluefield Research. “Sewer charges, in particular, represent a significant portion of monthly bills, highlighting the growing costs associated with wastewater treatment and regulatory compliance.” Over the past five years, sewer costs have consistently accounted for the largest portion of household utility bills, representing approximately 59% of households’ monthly utility bills. Since 2019, sewer expenses have exceeded the costs of water provision by an average of US$19.33 per month.
In 2024, the Northeast region had the highest average combined water and sewer bills, totaling US$141.53 per month. This is in contrast to the South, where the average was US$118.21 per month. An underlying factor in this difference is the older utility assets and systems in New England, which require costly upgrades.
Various factors, such as infrastructure age, localized climate risks, and respective state policies, influence regional water rate disparities. Monthly water bills vary significantly across the U.S., with prices as low as US$21.76 in Phoenix, Arizona, and as high as US$122.94 in San Francisco, California, illustrating extreme regional disparities.
“These regional cost variations not only highlight operational and infrastructure differences across cities but also raise concerns about the affordability of water and sewer services for households, particularly in lower-income communities,” emphasizes Bondar.
Exhibit: Household Water and Sewer Bills for 50 U.S. Cities, 2019–2024
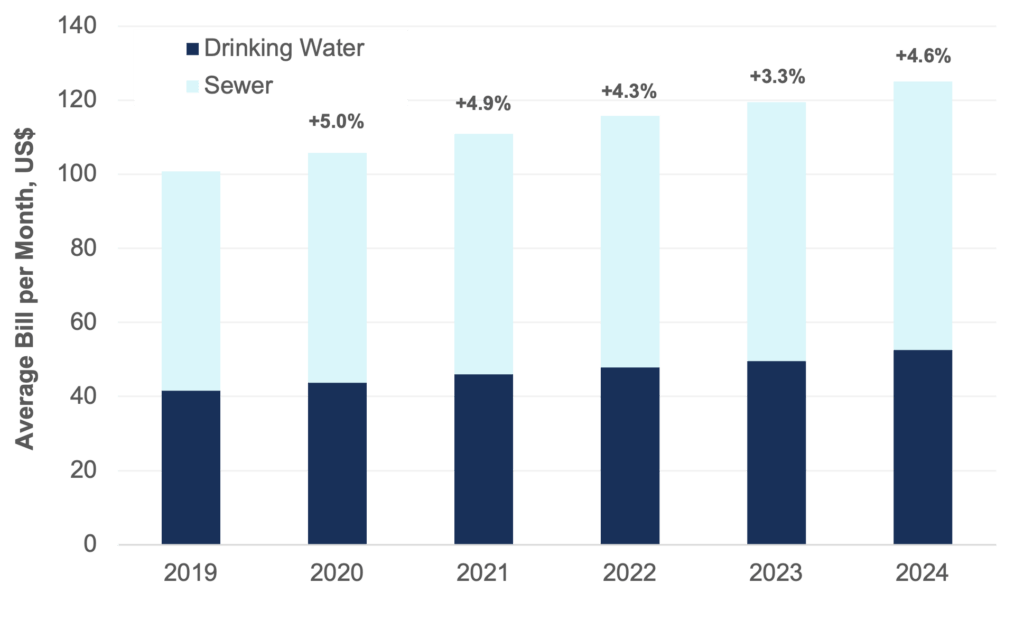
Source: Bluefield Research
Affordability challenges continue to grow. In cities like Birmingham, Alabama, and Cleveland, Ohio, combined water and sewer bills now exceed the U.S. Environmental Protection Agency’s affordability threshold of 4.5% of median household income. The analysis reveals that minimum-wage earners in select cities must work as much as 20 hours per month to cover their water and sewer bills. “The data highlights the affordability crisis many communities face and the difficult trade-offs that need to be made in balancing a utility’s financial sustainability with household affordability,” says Bondar.
Water utilities are employing various strategies to manage costs and ensure service delivery in response to these challenges. Common measures include tiered pricing models, seasonal rate structures, and low-income assistance programs. However, the fragmented nature of water and wastewater service providers in the U.S. leads to varying levels of implementation and effectiveness. “Unfortunately, there is no one-size-fits-all solution,” Bondar adds. “At this point, long-term planning and innovative approaches at the local level will be critical to sustaining water and sewer services.”
Bluefield’s year-over-year analysis underscores the mounting financial challenges for water utilities. New concerns about water quality, operating costs, and workforce shortages will continue to influence future rate structures. Other rising household costs, such as electricity, natural gas, and broadband access, exacerbate the financial impact of rising household water rates on consumers.
About this Analysis
For the ninth consecutive year, Bluefield Research has conducted a comprehensive analysis of drinking water and sewer rates across 50 of the largest U.S. cities and 61 utilities serving approximately 20% of the U.S. population. Access the complimentary report here. Bluefield clients can access the Water Rates dashboard on Bluefield’s Data Navigator platform.