Identify where digital water growth is concentrated across U.S. states and utility tiers
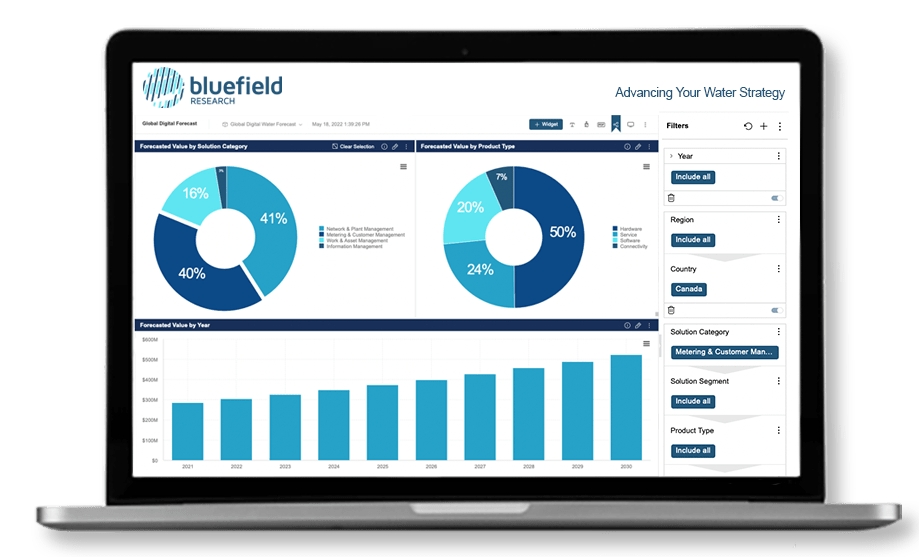
As utilities accelerate digital transformation, understanding where and how investment is being deployed is key to identifying growth opportunities. This dashboard provides a comprehensive forecast of the U.S. digital water market, highlighting spending across states, utility tiers, and solution segments—from SCADA and metering to asset management and analytics.
This data helps our clients address key questions:
- What is the 10-year outlook for the U.S. digital water landscape?
- How do digital water landscape opportunities vary by utility size?
- How does digital spend break out across hardware, software, and services?
How do I access Bluefield’s digital water forecast data?
Client access to our U.S. digital water forecast data is available with report purchase or through our Digital Water Landscape Corporate Subscription.
How many digital water solution segments does the dashboard cover?
The dashboard includes 36 solution segments, providing a comprehensive view of digital water investment across technologies such as SCADA, metering, asset management, analytics, and more.
How often is Bluefield’s digital forecast data updated?
Our digital forecast data is updated for clients on an annual basis. A corresponding dashboard for the global digital water market is also available, as well as additional national dashboards for key markets including Australia, Canada and Europe.
Become a Data Navigator Seat Holder
Talk to us about data access.
Worldwide Head of Development, AWS Water