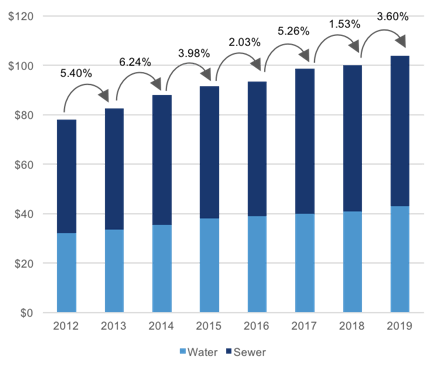
Boston, Massachusetts–U.S. municipal water & wastewater utility bills increased 3.6% over the last year, according to a new U.S. Municipal Water & Wastewater Utility Bill Index from Bluefield Research. Adjusting for inflation, this increase brings the combined average U.S. monthly water & wastewater bill to a US$104 average per household.
Bluefield’s annual analysis of utility water & wastewater rates demonstrates the extreme differences across the U.S., including rate structures and service fees. Of the top 50 U.S. metropolitan areas analyzed by Bluefield, 35 demonstrated increased rates from 2018 to 2019, while another 15 decreased or kept their rates constant during the same period.
“While water rates are rising overall, the year-to-year rate volatility and varied approaches by utilities is striking,” says Erin Bonney Casey, Research Director at Bluefield. “Given the escalating annual capital and operating expenditures currently exceeding US$110 billion nationwide, and the fact that rates represent a critical source of water infrastructure funding, one would expect to see more consistency, nationally and locally, over time.”
The volatility is evidenced nationally over the last eight years with annual average rate swinging from a 6.0% high in 2014 to a 1.5% low in 2018. This past year, the biggest changes occurred in El Paso, Texas and Riverside California, where average customer bills increased 33.3% and declined -22.0%, respectively.
There is also a wide discrepancy in the resulting customer bills based on estimated household water usage, which varies across regions. In 2018, combined water & wastewater bills ranged from a low of $30.16 in Memphis, Tennessee to a high of $226.62 in Seattle, Washington. The average combined bill for all cities analyzed topped $96.35.
Exhibit: Utility Water & Wastewater Bills for 50 U.S. Cities, 2019
Outside of ongoing customer management and volume-based charges, utilities are employing more complex, tiered water rate structures to address swings in customer demand (e.g. conservation), regulatory enforcement (e.g. consent decrees), and non-revenue water (e.g. leakage, customer non-payment). At the same time, water rate increases are often politically charged and cause for year-to-year rate volatility.
To account for declines in revenues, utility rate structures have relied more heavily on fixed rate structures. As an example, since 2012, fixed wastewater rates have increased by 60.9%, while variable rates have risen only 39.1%. The impact is that low volume users, often the lowest income households, are most affected by rate increases.
“Some utilities are addressing affordability challenges head-on with unique programs,” says Ms. Bonney Casey. “Going forward, we expect to see more tailored programs, like Philadelphia’s TAP pricing model that accounts for affordability in its pricing model rather than more standard, post-billing rebate programs.”
About Bluefield Research
Bluefield Research provides data, analysis and insights on global water markets. Executives rely on our water experts to validate their assumptions, address critical questions, and strengthen strategic planning processes. Bluefield works with key decision-makers at municipal utilities, engineering, procurement, and construction firms, technology and equipment suppliers, and investment firms. Learn more at www.bluefieldresearch.com.
