In this Data Insight, Bluefield water experts analyze water and wastewater rates for 55 utilities across the U.S. to identify key trends in municipal water utility pricing.
Bluefield’s analysis of customer billing rates across 50 metropolitan areas shows a five-year increase exceeding 25% from 2012-2016. Municipal utilities are applying a mix of volume-based and fixed rate mechanisms for cost recovery, exposing utilities to swings in water usage.
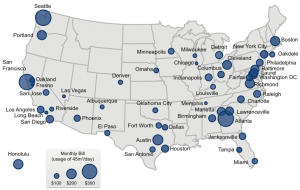
Regional variation in water and wastewater rates demonstrate the distinct water management challenges faced by cities around the U.S. Based on average U.S. water usage, household water and wastewater bills in 2016 range from a high of US$321 in Seattle to a low of US$42 in Fresno.
Sample Exhibit: Utility Water and Wastewater Bills Across 50 US cities, 2016

(Insight clients also receive access to accompanying data appendix outlining water and wastewater rates by city).
Follow the links below for more analysis of utility strategies in US water markets:
- US Municipal Water Infrastructure Forecasts: Utility Strategies & CAPEX Forecasts, 2016-2025
- US Private Water Utilities: Market Trends, Strategies and Opportunities, 2016
- US & Canada Municipal Infrastructure Insight
Contact our water experts for more information on our data, analysis and insight in this area.
Bluefield Takeaways
- Bluefield’s analysis of customer billing rates for municipal water and wastewater services across 50 U.S. cities show a five year increase exceeding 25% from 2012 to 2016.
- Overall the cost of wastewater is more expensive than water across all US cities
- Average household bills for water and wastewater combined have increased on average from US$134 in 2015 to US$141 in 2016.

